

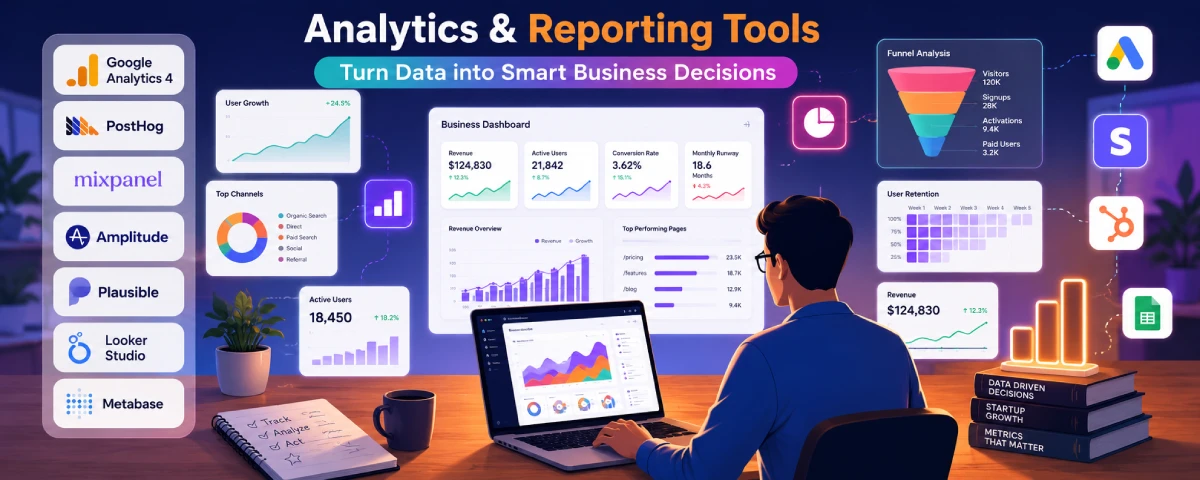
Despite the fact that businesses gather data, they still base their decision-making processes on instincts. Traffic numbers sit in one tool, product usage in another, revenue in Stripe, and nobody has a clear weekly view of what’s actually working. The right analytics and reporting stack fixes that without requiring a data team on day one.
For the overarching strategy, read our complete guide on Startup Tools
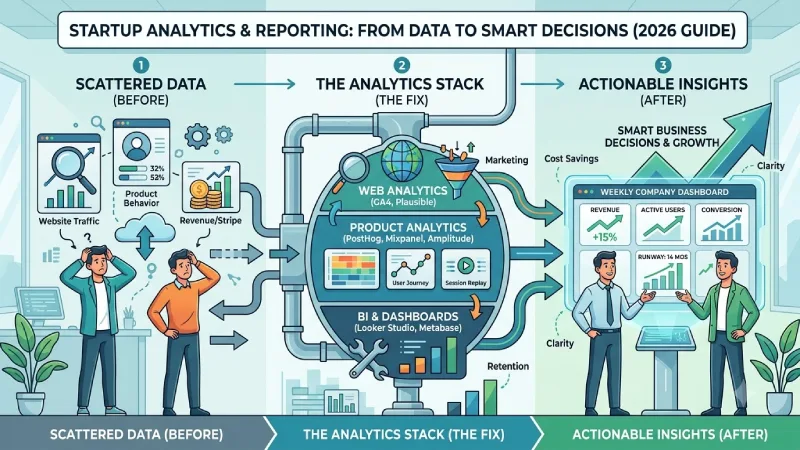
Here’s a practical guide to the tools startups use in 2026 for web analytics, product behavior, dashboards, and business intelligence.
Best analytics tools for startups
Different tools answer different questions. Here’s a clear overview:
| Tool / Category | Best for | Free plan? | Starting paid | Key strength |
| Google Analytics 4 | Website traffic & marketing | Completely free | Free | Acquisition & campaign tracking |
| PostHog | Product analytics + all-in-one | Yes (generous) | Usage-based | Events + session replay + flags |
| Mixpanel | Funnels & user behavior | Yes (high event limit) | Usage-based | Fast funnel & retention analysis |
| Amplitude | Deep retention & cohorts | Yes | Usage-based | Strong retention modeling |
| Plausible / Fathom | Simple privacy-first web stats | Limited / paid | From ~$9/mo | Clean, lightweight dashboards |
| Looker Studio / Metabase | Dashboards & BI | Yes (strong free options) | Free or low cost | Connecting multiple data sources |
Start with the addition of GA4 on both your website and marketing website. Install the product analytics software (PostHog, Mixpanel, or Amplitude) once your users start utilizing your product. Just overlay dashboards on top so that everyone sees the metrics.
Google Analytics 4 for startups
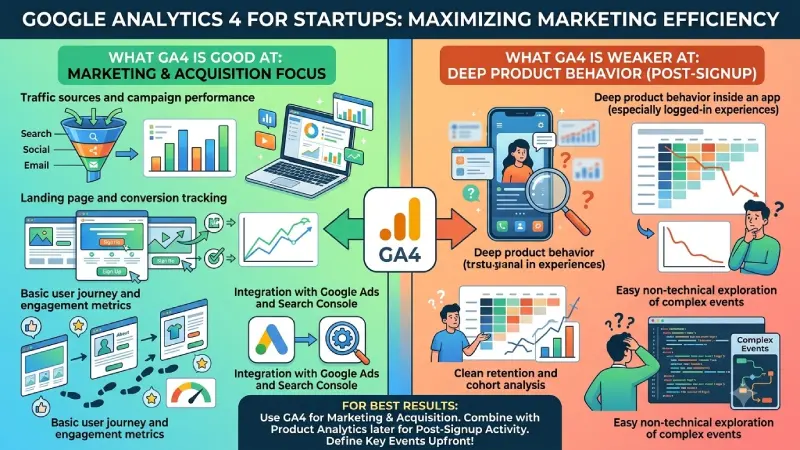
GA4 is still the default free web analytics tool and every startup should have it installed.
What it’s good at:
- Traffic sources and campaign performance
- Landing page and conversion tracking
- Basic user journey and engagement metrics
- Integration with Google Ads and Search Console
What it’s weaker at:
- Deep product behavior inside an app (especially logged-in experiences)
- Clean retention and cohort analysis
- Easy non-technical exploration of complex events
It is best to use GA4 for marketing and acquisitions issues, and later on use GA4 in tandem with a good product analytics tool for all post-sign-up activities. Define your key events and conversions upfront to ensure clean data down the road.
Business intelligence tools for small business
When you have your data collected in a couple of places (Stripe, HubSpot, GA4, Product Analytics), you need a tool for aggregating it in meaningful ways.
Popular options for startups:
| Tool | Best for | Pricing note | Why startups use it |
| Looker Studio | Google ecosystem dashboards | Free | Easy connection to GA4, Sheets, etc. |
| Metabase | Open-source / self-hosted BI | Free self-host or low cloud | Founder-friendly, SQL + simple UI |
| Power BI | Microsoft / Excel-heavy teams | Free desktop + low Pro | Strong if already in Microsoft world |
| Tableau | Investor-ready polished visuals | Higher cost | Beautiful charts when you need them |
| Databox / similar | Quick KPI dashboards | Mid-range | Fast setup from many data sources |
Looker Studio (free version) and Metabase are the most frequently used options for a start. Most companies use basic reports from Looker Studio with GA4 and Google Sheets data initially and switch to Metabase or warehouse integrated platform later on.
Dashboard and reporting tools
The goal is not fancy charts — it’s regular visibility so decisions get better.
Useful practices:
- One weekly company dashboard that shows the 5–8 metrics that actually matter (revenue, active users, conversion rates, runway, etc.)
- Separate marketing, product, and finance views so people aren’t drowning in irrelevant numbers
- Automatic delivery (email or Slack) so the team sees the numbers without opening a tool every time
- Keep early dashboards simple. Too many charts = nobody looks at them
Proper use of the available tools like Looker Studio, Metabase, Databox or even Google Sheets will do well, upgrade if the current solution is making things too difficult.
Product analytics platforms for startups
This is where you learn how people actually use your product — activation, feature adoption, drop-off points, and retention.
| Tool | Best for | Free tier highlight | Notes |
| PostHog | Technical teams wanting one tool | 1M events + session replay | Open-source option, includes flags & A/B |
| Mixpanel | Growth & product teams | High free event volume | Excellent funnels and cohorts |
| Amplitude | Retention-focused analysis | Solid free tier | Strong when retention is the main question |
| Heap | Teams that want autocapture | Limited free | Captures a lot automatically |
PostHog has become very popular with early technical startups because one tool covers analytics, session recordings, feature flags, and experiments. Mixpanel remains a favorite for clean funnel and retention work. Amplitude shines when you need deeper cohort and retention modeling.
Most pre-PMF teams only have to measure a few basic events (signup, activation process, important actions, retention). Measuring too much from the start will simply create confusion, not insight.
Country / region notes
- For the global markets, the default options will be GA4 and product analytics solution (PostHog/Mixpanel/Amplitude).
- For Europe, the privacy-focused markets, Plausible, Fathom, or self-hosted PostHog will be chosen.
- For the Microsoft-centric regions, Power BI will be preferred.
- Open source alternatives like Metabase and self-hosted PostHog get more traction when data residency and cost matter more.
How to build a practical analytics stack
- For European countries that want to ensure their privacy, Plausible, Fathom, or self-hosted PostHog would be preferred.
- Power BI would be used in situations where Microsoft dominates. In cases where data residency and costs become important, open-source solutions like Metabase and self-hosted PostHog gain more popularity.
- Create one simple weekly dashboard that the whole team looks at.
- Only add more tools when a clear question can’t be answered with what you already have.
- Focus on a small number of metrics that actually drive decisions. Vanity numbers waste time.
A realistic early stack for many startups:
- Web / marketing: Google Analytics 4
- Product behavior: PostHog or Mixpanel (free tier)
- Dashboards: Looker Studio or Metabase
- Revenue: Stripe dashboard + simple spreadsheet or connected BI
Data does not mean anything unless you interpret and use it. Start with a slim pile of data and make sure to always look at the numbers, putting more into the pile only when things become challenging.
What kind of product do you have (SaaS, marketplace, consumer, etc.), and what metrics are more challenging to measure right now? This will help determine what other tool should be used next.
FAQ
1. Which analytical tools must startups begin with?
GA4 to track data related to websites and marketing efforts; product analytics software (PostHog, Mixpanel, or Amplitude) when users begin interacting with the product. Also, implement a layer for dashboards (Looker Studio, Metabase).
2. Is Google Analytics 4 enough on its own?
No. GA4 is excellent for traffic, campaigns, and acquisition, but weak for deep in-app behavior, retention, and cohorts. Pair it with a proper product analytics tool.
3. Which product analytics tool is best for early startups?
PostHog is popular with technical teams (events + session replay + feature flags in one tool). Mixpanel is strong for funnels and retention. Amplitude excels at deeper cohort analysis.
4. Do I need expensive business intelligence tools?
Not at the start. Looker Studio (free) or Metabase handle most early dashboard needs. Upgrade only when connecting multiple data sources becomes painful.
5. How do I not drown in data?
Focus on tracking only a handful of KPIs which actually impact the decision-making process. One standard dashboard per week for your whole organization via email/Slack. Introduce any new tools only if a particular query can’t be solved through existing tools.
Conclusion
It makes no sense to have data unless you look at it and make something out of it. Start simple: GA4 for marketing data and one product analytics tool for user data. Focus on just a few metrics that you care about and only grow your stack when needed.
To take the next step, see our detailed guide on Project Management Tools for Startups.