


Indeed, anyone who ever found himself staring at a seemingly sufficient balance sheet, but experiencing that uncomfortable tension about next payroll cannot miss the distinction between profit and cash. Profit is an accounting tale; cash is the fuel for lights, suppliers and peaceful nights. I have seen many good businesses struggling through difficult times not because of lack of profits but because of the lack of money at the right time. Therefore, cash flow management is not a sophisticated task of finance department only, it is the everyday management of knowing the money going in and out of business and understanding the potential discrepancies in this process.

In this piece, we will go into the depth of forecasting, managing and analyzing cash flow, will see what figures should be focused on, draw recent statistics comparing country and year in well-recognized surveys without going into excessive jargon.
Cash Flow Is Not Profit — And Why That Gap Matters
Profit is revenue minus expenses after all the accounting adjustments. Cash flow is simply the money that actually moves in and out of your accounts. While your cash flow is dwindling away, you can still be making healthy profits owing to your customers’ delay in payments, excess inventory, and your push to the limit with the payables period.
An illustrative case would be of an expanding business that records a substantial sale, profits from the same, but does not receive the payment for 60 or 90 days, while at the same time paying its employees and vendors on a weekly basis.
Recent data shows this problem is widespread:
- Global working capital requirements (the cash tied up in day-to-day operations) hit 78 days of turnover in 2024 — the highest since 2008, according to Allianz Trade research.
- Partial figures into early 2025 suggested the pressure hadn’t eased much.
- Western Europe saw especially sharp rises (+4 days in some reports).
- North America managed some improvement through destocking.
Small businesses feel it hardest:
- Firms operating in Australia, New Zealand, and the UK have been found to encounter a minimum of one month of negative cash flow per year, with more than 90% of the total firms facing such difficulties.
- The number of months with negative cash flow stands at an average of four months for firms in general (4.2 months in Australia, 4.0 in New Zealand, and 4.5 in the UK).
- Twenty percent of the small Australian firms and 25% of the UK firms faced negative cash flow for a period of six months or more during the period under review.
- Tardy payments from customers intensify the problem.
The gap between profit and cash is not a technical accounting issue. It is the practical reason many otherwise healthy businesses suddenly feel the pressure.
How Cash Flow Statements and Forecasts Actually Work

Cash flow is classified under three categories in the cash flow statement: operating activities (the ongoing operations of selling and buying goods), investment activities (selling and purchasing long-term investments), and financing activities (loans, equities, and dividends). Most operational managers operate within the scope of the operating activity category. This is where all receivables, payables, and inventories are located.
The following two methods may be used in order to prepare the statement:
- The direct method lists cash flows from operating activities.
- The indirect method begins with net income and adjustments.
Forecasts take the same idea forward. The 13-week rolling cash flow forecast is a common tool because it makes you think about weekly forecasts of money coming in from customers, payments for employees, payments to suppliers, taxes, rent, and major non-recurring transactions. You start off with the opening balance of your bank account, add up the projections of money coming in and take away the projections of money going out each week and watch the closing balance of your bank account each week.
Here’s what a simple 13-week forecast usually includes:
- Opening cash balance for the week
- Expected customer receipts (by major customer or category if helpful)
- Other known inflows (tax refunds, loan drawdowns, etc.)
- Payroll and related costs
- Supplier and bill payments
- Rent, utilities, loan repayments, and tax
- Any large one-off items
- Closing cash balance
I’ve seen teams treat the forecast as a living document rather than a once-a-quarter exercise. When a big invoice slips or a supplier offers an early-payment discount, the forecast shows the impact immediately. Scenario versions help too — what happens if collections slow by ten days, or if a key customer stretches terms? It’s not about absolute precision, it’s about enough visibility to take action before the gap turns into a crisis.
Tracking Cash Flow: The Reports That Keep You Honest
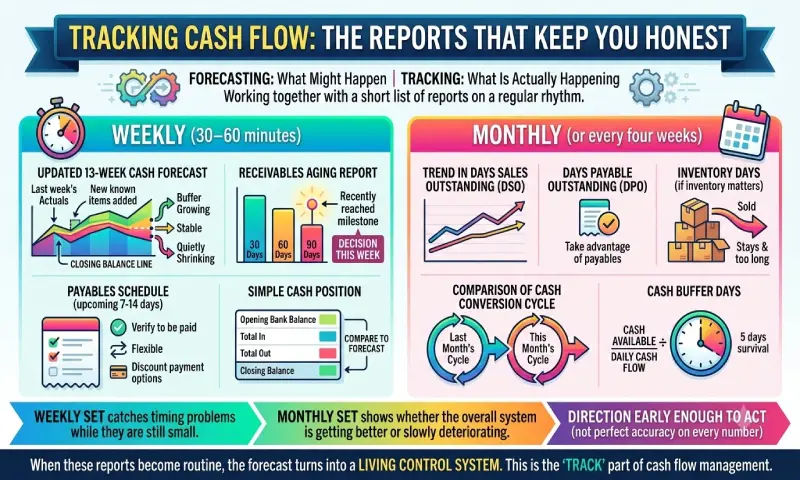
Forecasting shows you what might happen. Tracking shows you what is actually happening. The two only work together when you look at a short list of reports on a regular rhythm.
Most teams that stay in control don’t drown in dashboards. They check the same few things every week and a couple of deeper ones every month.
Weekly (30–60 minutes is enough)
- Updated 13-week cash forecast — bring in last week’s actuals and any new known items. Look at the closing balance line. Is the buffer growing, stable, or quietly shrinking?
- Receivables Aging Report – Concentrate on the 30, 60 and 90-day columns. Any item which has recently reached a milestone will require your decision this week.
- Payables Schedule for the upcoming 7-14 days – Verify which is to be paid, which is flexible and whether any discount payment option is available..
- Simple cash position — opening bank balance, total in, total out, closing balance. Compare it to what the forecast predicted.
Monthly (or every four weeks)
- Trend in Days Sales Outstanding (DSO) – is the time for collections increasing, steady, or getting longer?
- Days Payable Outstanding (DPO) – are you taking advantage of your payables more or less than expected?
- Inventory days (if inventory matters) – are your main inventory items being sold as expected or staying on hand for too long?
- Comparison of cash conversion cycle with last month’s cycle – the direction only is generally sufficient.
- Cash buffer days (cash available ÷ daily cash flow) – one figure that will tell you how many days you could survive without any new cash inflows.
The weekly set catches timing problems while they are still small. The monthly set shows whether the overall system is getting better or slowly deteriorating. You don’t need perfect accuracy on every number. You need to see the direction early enough to act.
When these reports become routine, the forecast stops being a one-time exercise and turns into a living control system. That is the “track” part of cash flow management in practice.
Receivables and Payables: The Two Levers That Move Cash Timing

Accounts Receivable refers to the amount that your clients owe you after you have delivered the goods or rendered services. The more time passes, the longer the funds stay in the hands of your clients. The payment terms specify the period – net 30, net 45 or net 60, but the actual payment schedule deviates from these terms due to invoice inaccuracies, the way you pursue the payment and dispute resolution procedures.
An aging report is the most frequently used report in practice. The aging report divides your outstanding invoices by categories such as current balance, 1 to 30 days past due, 31 to 60 days past due, 61 to 90 days past due, and beyond 90 days past due. Monitoring the DSO trends helps determine whether the collections are improving or deteriorating. Accurate invoicing eliminates easy excuses while reminder letters and dispute resolutions keep good relations with the client and get paid at the same time.
On the other side sits accounts payable — what you owe your suppliers. Stretching those terms can free up cash in the short run, but push it too far and you risk strained relationships or losing early-payment discounts that were actually worth taking. Organising invoices by due date, putting simple approval controls in place so the same bill doesn’t get paid twice, and lining up payment runs against the cash you actually have available are the unglamorous habits that make a difference. Tracking days payable outstanding (DPO) shows whether you’re managing the balance or just kicking the problem down the road.
Country differences are real and they show up clearly in the numbers. Recent payment practice surveys and working capital studies paint a mixed picture. Here’s a simplified look at overdue B2B invoices from recent Atradius-style barometers and related research (percent of credit-based sales that were overdue):
| Country / Region | Overdue B2B invoices (approx.) | Bad debt / write-off notes |
| India | ~63% | Among the highest; write-offs ~7% |
| United Kingdom | ~54% | Persistent late-payment pressure |
| Central & Eastern Europe | ~53% | Elevated across several markets |
| Latin America | ~51% | Informal sector adds complexity |
| Western Europe (average) | ~47% | Varies sharply by country |
| United States | ~43% | Still material; ~5% bad debt |
| Asia (broader average) | ~44% | Wide spread between markets |
| Canada | ~44% | Similar to US pattern |
| Australia | ~38% | Relatively better |
These are snapshots from 2024–2025 surveys. Individual sectors and company sizes swing the numbers even more.
On the pure timing side, days sales outstanding and days payable outstanding also differ by region. Drawing from Allianz Trade and similar large-sample studies around 2024–2025:
| Region | Typical DSO range (days) | Typical DPO notes | What it means for cash |
| Asia | Often highest (~59) | Lower DPO (~44) | Cash stays trapped longer |
| Western Europe | Mid-50s to high-60s | Mixed; some countries pay suppliers faster | Germany and France often longer cycles |
| North America | Lower 40s to low 50s | More balanced | Generally tighter cycles |
| Global average | ~56–57 | Varies | Slight upward drift in recent years |
- A few country-level examples that stand out: Germany saw DSO rise in 2025 (around +2.8 days to the mid-50s in one set of figures), while some Asian markets like Australia and Singapore improved their collection times. Thailand, by contrast, saw sharp lengthening in certain surveys. North America has tended to keep customer payment terms shorter than Asia.
- I’ve watched businesses in high-overdue markets treat collections almost like a second sales process — regular, polite, but relentless follow-up. In lower-overdue places the same teams can afford to be a bit more relaxed, but the principle stays the same: the aging report doesn’t lie. If either of the 60- and 90-day buckets begins to swell up, there must be some issue with the process before the cash buffer takes the hit.
- The key practical point is clear – manage your receivables and payables as the two primary knobs you can manipulate. Tighten one without snapping the other. Proper billing and systematic collection on the customer side. Structured due date management and thoughtful payment schedule on the supplier side. Keep an eye on regional trends when dealing internationally, since the invoice that will clear within 30 days in one market might hang around for 70 in another. Companies which remain solvent make sure these two knobs remain regularly monitored instead of reacting to the bank statement.
Working Capital: The Bigger Picture of Cash, Stock, and Payments
Working capital is the difference between current assets and current liabilities, including cash, accounts receivable, inventory on one hand, and account payable on the other hand. Cash conversion cycle (which is the time that is taken to convert inventory and receivables into cash, after deducting payables) is the best way to measure efficiency.
Inventory sits in the middle. Holding more stock than you need ties up cash. Running too lean risks stockouts and lost sales. The connection between inventory, receivables, and payables is what the cash conversion cycle captures. A growing business often finds cash getting trapped as it scales — more inventory to support higher sales, longer collection times from bigger customers, and pressure to pay suppliers faster to keep supply lines open.
Liquidity ratios and trade-offs come into play when you start releasing that tied-up cash. Cutting inventory or tightening receivables frees money, but only if operations can handle it. Extending payables frees money too, but at the risk of supplier goodwill or lost discounts.
Regional patterns from recent working capital studies show clear differences. North America has managed some reduction in net working capital days over the longer term, partly by pushing out payables. Europe has seen rises, driven especially by inventory. Asia shows mixed results with pockets of longer cycles. Excess working capital sitting on balance sheets globally runs into the trillions of euros or dollars depending on the study — money that could fund growth, reduce debt, or buffer uncertainty if released.
Here’s a simplified year-wise look at some key trends drawn from multiple recent surveys (PwC, Allianz Trade, PYMNTS, Hackett Group and others). Numbers are approximate averages or reported medians and will vary by sector and company size:
| Metric / Region | Around 2015 | ~2023–2024 | 2024–2025 notes |
| Global WCR / CCC days | Lower base | ~67–76 | Rose to ~78 in 2024, near post-2008 high |
| DSO (global) | ~47 days | ~50 days | Continued upward pressure |
| NWC days UK | Baseline | +48% rise | Sharp inventory and other increases |
| NWC days EU | Baseline | +9.5% | Driven by inventory |
| NWC days North America | Baseline | -8% ish | Helped by longer payables |
| Asia cash cycle | — | Higher | Often longest regional cycles |
Country and regional comparisons on payment behaviour and buffers also matter:
| Country / Region | % B2B Invoices Overdue (recent) | Notes on cash pressure |
| India | ~63% | Highest in many surveys |
| UK | ~54% | Persistent late payment issues |
| Central & Eastern Europe | ~53% | Elevated |
| Latin America | ~51% | Informal sector impact |
| Western Europe | ~47% | Varies by country |
| United States | ~43% | Lower but still material |
| Asia average | ~44% | Wide variation by market |
| Australia | ~38% | Relatively better |
These are snapshots. Sector differences are often larger than country differences — manufacturing and construction tend to run longer cycles than media or certain service businesses.
Spotting and Fixing Cash Shortages
Negative cash flow isn’t always a disaster. Temporary gaps from seasonality, growth investment, or a one-off project are common. Recurring negative cash flow that isn’t planned is the danger sign.
Separate timing gaps (money will arrive, just later) from true operating losses. Prioritise near-term commitments: payroll, critical suppliers, tax, debt service. Review collections processes, cost structure, and payment terms regularly. When the gap looks structural or the buffer is too thin, talking to lenders or advisors early is usually better than waiting.
A practical buffer target for many smaller firms is 60–90 days of core operating expenses. The median small business sits closer to 27 days in some US data, which leaves little room for surprises. Building that buffer is itself a cash management goal.
Putting It Together in Practice

It is less about making the perfect prediction and more about good discipline in cash flow management. Maintain an up-to-date 13-week view of your cash flow. Examine the aging of your accounts receivable and your payable schedule weekly. Monitor your inventory turn. Make comparisons between actual results and forecasts, then make adjustments. Use data to determine whether you should aggressively collect, take a discount on payment, defer a non-critical expense, or raise some funds.
Country and year trends serve as a reminder that conditions change. Payment practices, interest rates, reliability of the supply chain, and customers’ demands change. What works in the period of low interest rate environment does not work anymore if interest rates have risen or trade friction has extended the cycle. Those who stay ahead do not treat cash visibility as a process that is done once in a while.
I have learned that the simple approach of having an accurate forecast on a weekly basis, maintaining neat invoices, collecting on time, and communicating with suppliers and customers wins over complicated and impractical forecasting model that no one looks at. It is not about perfection but sufficient data to make decisions and sufficient cushion for unexpected events.
If you’re just starting, pick one piece. Build the 13-week forecast and update it for a month. Or clean up the receivables aging and set a simple collection cadence. Small consistent steps compound. Cash flow management isn’t glamorous, but it’s one of the highest-leverage things most businesses can improve. Get the timing right and a lot of other problems become easier to solve.
Here’s how that actually looks week to week for most teams I’ve seen work well.
A simple weekly rhythm that sticks
Most people who keep cash under control don’t run a complicated process. They run a short, repeatable loop:
- Update the 13-week cash forecast with last week’s actuals and any new known movements (big invoices, payroll changes, tax deadlines, loan payments).
- Open the receivables aging report. Flag anything that just moved into 30+, 60+, or 90+ days. Decide who calls whom this week.
- Glance at the payables schedule. Confirm what must be paid to keep supply and relationships intact, what can wait a few days, and whether any early-payment discounts are still worth taking.
- Check inventory if it’s a material part of the business — is stock turning as expected or is cash getting stuck on the shelf?
- Note any gap or surplus that appears in the next 2–4 weeks and decide one concrete action.
The entire process can take 30 to 60 minutes once all the basic reports are completed. The key is performing this exercise on a weekly basis rather than monthly because the money is tight in the bank account.
Practical examples of the small decisions that move the needle
- An intermediate-size wholesaler found that three of its big clients took their average payment period from 35 days to 55 days. Rather than waiting, they adopted a friendly yet insistent phone call schedule for all overdue bills over 40 days, with a slight incentive for early payments on the next invoice. Within six weeks, the average period went below 40 days again, and the cash cushion gained about two weeks’ worth of costs.
- A services firm was stretching supplier payments to 60–70 days to protect cash. One key supplier started quietly delaying deliveries. They sat down, agreed on a 45-day average in exchange for priority scheduling, and locked in a modest volume commitment. Cash timing got a little tighter but supply reliability improved and the relationship stabilised.
- A growing manufacturer built a simple rule: any invoice over a certain size gets a same-day accuracy check and a personal confirmation email to the customer’s accounts payable contact. Dispute rates fell and the 60-day bucket shrank noticeably.
These aren’t dramatic turnarounds. They’re the kind of ordinary adjustments that compound when you look at the numbers regularly.
How the environment shows up in the numbers
But payment behaviour and working capital pressures do not remain constant. This is a brief look at some general trends which have emerged from recent multi-country studies (Allianz Trade, Atradius style, PwC style working capital studies, circa 2024/2025):
| Focus area | Recent pattern (2024–2025) | Practical implication for weekly review |
| Customer payment delays | Still elevated in many markets; India, parts of Europe and Latin America often higher | Watch the 30- and 60-day aging buckets more closely if you sell into those regions |
| Days Sales Outstanding (DSO) | Global average roughly mid-50s; Asia often longer | If your DSO is drifting up while peers in your market are stable, collections process needs attention |
| Supplier payment stretch (DPO) | Mixed — some regions paying suppliers faster, others stretching | Check whether longer payables are buying real breathing room or just creating quiet supply risk |
| Inventory (DIO) | Elevated in many Western markets as firms built buffers | Ask whether the extra stock is protecting sales or simply trapping cash |
| Overall cash conversion cycle | Structurally higher than pre-2020 in several regions | Build a slightly larger cash buffer than felt necessary a few years ago |
The point of the table isn’t to memorise the numbers. It’s a reminder that the same habits need to flex when the external picture changes. Interest rates that are higher increase the cost of captive money. Increased supply chain length complicates the process of inventory management. Change in consumer payment culture affects the collection efforts.
Start Small and Build the Habit
In case that entire week loop seems to be too big to start with, try running one part of it for four weeks:
- Option A: Create a simple cash flow forecast for 13 weeks (beginning balance + incoming money – outgoing money). Do it on Fridays with updated figures. You’ll notice patterns you couldn’t before within one month.
- Option B: Tidy up your aging report and create a simple policy of reminders – a gentle nudge if overdue for more than 30 days and a call if more than 45 days. See how many of them leave those buckets.
- Option C: Make a list of all suppliers with upcoming bills for the next 30 days. Specify which ones can’t be delayed, which ones have room for discounts and which ones could do with some slack.
Most teams that stick with one of these for a month find the next step feels natural. The forecast starts to feel useful. The aging report stops being a monthly surprise. Conversations with customers and suppliers become more factual and less awkward.
Cash flow management rarely looks impressive from the outside. It’s the quiet discipline of looking at the same few reports every week, making small adjustments, and keeping enough buffer so that a late payment or an unexpected cost doesn’t turn into a crisis. Get the timing right and a surprising number of other business problems become easier to handle.
FAQs on Cash Flow Management
- What is the difference between cash flow and profit, and why is this difference so significant?
While profit shows how many net income is recorded by your accounting system (after all expense deductions, including depreciation), cash flow reflects the amount of money coming into your bank account and going out of it. Your business could be profitable according to your accounting system and run out of cash if customers are slow to pay, inventory stays too long, or some major expenses come before the cash has been received. Many companies have difficulties not due to lack of profit, but because of the lack of synchronization of money flow. Cash flow monitoring will help you stay liquid, whereas monitoring profits might surprise you.
- What would be the easiest approach to building 13 weeks cash flow forecast if I’ve never done this before?
Just open an Excel sheet. Write down your current bank account balance at the beginning of week one. Now make a list of incoming cash flows (payments from customers, and so on) and outgoing cash flows (wages, rent, payments to suppliers, taxes, loan repayment, etc.) for each of the next 13 weeks. Calculate and update the cash
- How frequently should I examine my receivables and payables, and what should I be looking for?
Ideally, once per week would work best for most companies. As far as receivables go, you would want to examine the aging report and see how much money has aged to 30-, 60-, and 90-day buckets. Determine which of the outstanding invoices require sending a reminder or making a phone call during the week. As far as payables go, identify how much will be due during the upcoming 7-14 days, if there are discounts available, and which payments could be postponed without harming relationships or affecting supply chain.
- How much cash buffer is normal and what would be a warning sign about mine being too small?
The general guideline applicable to smaller and mid-sized enterprises would be 60-90 days of core business expenses (employee salaries, rent, main suppliers’ payments, etc.). There are some statistics on small enterprises showing that the median of cash buffers is only 27 days, leaving little room for unexpected payment delay or an expense. To determine if your cash buffer is insufficient, calculate your average cash outflow per day and divide the available cash you have by that
- Under what circumstances would I require external help or short term financing?
If the problem is a lack of cash in the short term due to a problem with a receivable or because of an investment in growth, short term financing in the form of a line of credit, invoice discounting or overdraft may be a solution. If the problem is a long-term negative cash flow that came unexpectedly or due to regularly exceeding payment terms and pushing the suppliers too far, it would be wise to get expert advice as soon as possible.
Conclusion
Cash flow management need not be an exercise in complicated modeling and exact forecasting. It simply means that you must be systematic in knowing where your money comes from, where it goes, and whether there is an imbalance between the two. You must keep on top of the essential financials on a week-by-week basis, look at things in terms of a 13-week period, handle your receivables and payables, and have enough cash cushion. With those things in place, most of the surprises that usually knock out healthy companies will become a way of life. Timing is everything.