

Marketing Budget The most frequently asked question by entrepreneurs is: “How much should I spend on marketing?”
There is no one-size-fits-all solution. It depends on the industry of your company, development stage, growth plans, and effective usage of resources. If you invest too little – the growth will be slow; and, if you waste money inappropriately – the loss will be great.
This manual describes the true meaning of the marketing budget, its importance, various methods of calculating and allocation, practical application and costly mistakes made by companies.
Marketing Budget: Meaning and Key Concepts
Definition of Marketing Budget
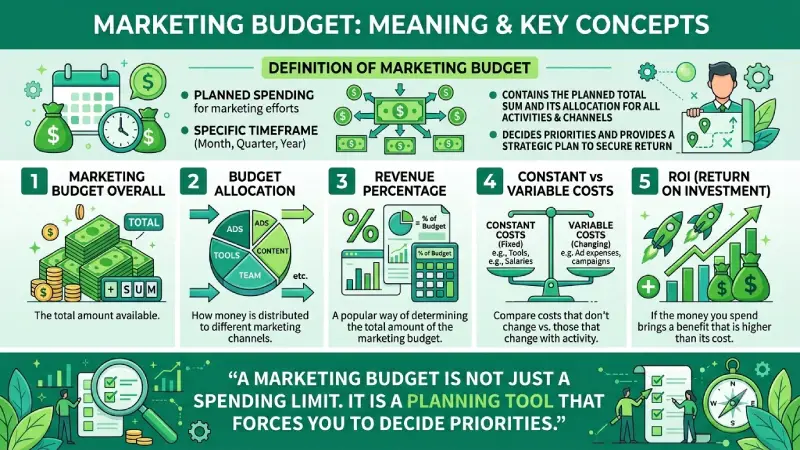
It refers to the planned spending for marketing efforts in a given timeframe. Such a timeframe can either be a month, quarter, or year. A marketing budget contains not only the sum but also the allocation for each activity and channel.
The essential things to comprehend include:
- Marketing budget overall: The total amount available.
- Budget allocation: How this money is allocated for different marketing channels (ads, content, tools, people, etc.).
- Revenue percentage: A popular way of determining the total amount of the marketing budget.
- Constant vs. variable costs: Costs that do not change regardless of activity (tools, salaries) versus costs that change based on activity (ad expenses).
- ROI: If the money that you spend brings the benefit that is higher than its cost.A marketing budget is not just a spending limit. It is a planning tool that forces you to decide priorities.
Why Marketing Budget Matters
Without a defined budget, marketing becomes impulsive. People spend money out of optimism and stop spending money out of fear. This is not an efficient way to operate.
A proper marketing budget helps you:
- Control costs and avoid surprises
- Decide which activities deserve money and which do not
- Measure whether marketing is actually helping the business
- Plan ahead instead of reacting every month
- Make better trade-offs when resources are limited
Information currently available within the period 2025-2026 suggests that the average marketing budgets are often between 7.7% and 9% of the company’s income. But once again, an extremely wide distribution can be observed as well because some industries and emerging firms allocate a greater portion of their income to marketing, while others do less..
Key Types, Methods, and Examples
There are several common ways to set a marketing budget.
Percentage of Revenue Method
This is the most widely used approach. You decide to spend a certain percentage of your revenue on marketing.
| Business Situation | Typical Marketing Spend (% of Revenue) | Notes |
| Startup / Early stage | 12–25% | Higher spend to gain traction |
| Growing small-medium business | 10–20% | Balanced growth focus |
| Established business | 5–12% | Efficiency becomes more important |
| B2B companies (general) | 5–12% | Often lower than B2C |
| B2C / Consumer brands | 9–18% | Higher visibility needs |
| SaaS / Software | 12–25% | High customer acquisition focus |
| Manufacturing / Industrial | 3–7% | Lower marketing intensity |
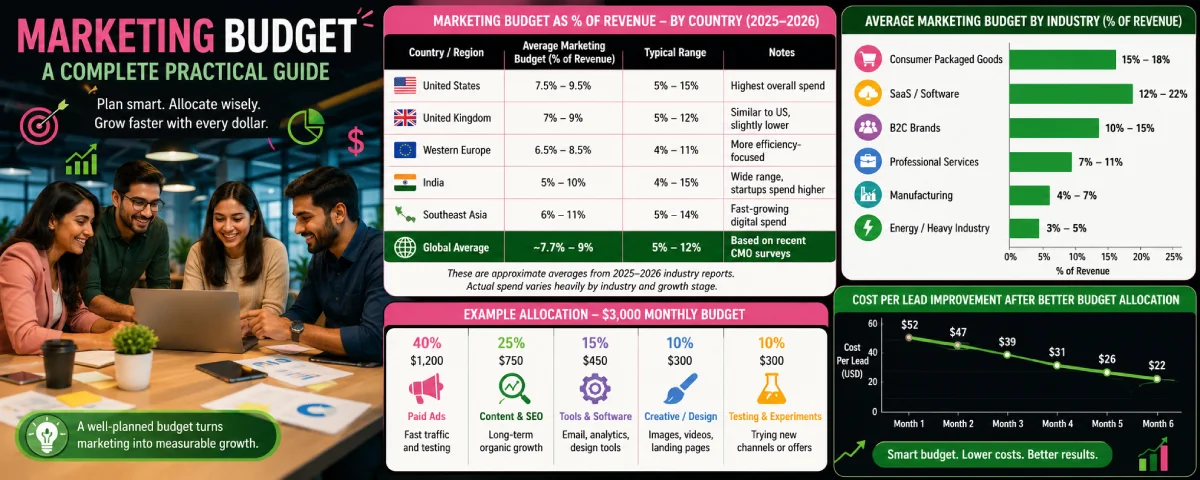
Marketing Budget as % of Revenue – Country / Region Comparison (2025–2026)
| Country / Region | Average Marketing Budget (% of Revenue) | Typical Range | Notes |
| United States | 7.5% – 9.5% | 5% – 15% | Highest overall spend |
| United Kingdom | 7% – 9% | 5% – 12% | Similar to US, slightly lower |
| Western Europe | 6.5% – 8.5% | 4% – 11% | More efficiency-focused |
| India | 5% – 10% | 4% – 15% | Wide range, startups spend higher |
| Southeast Asia | 6% – 11% | 5% – 14% | Fast-growing digital spend |
| Global Average | ~7.7% – 9% | 5% – 12% | Based on recent CMO surveys |
“These are approximate averages from 2025–2026 industry reports. Actual spend varies heavily by industry and growth stage.”
Average Marketing Budget by Industry (% of Revenue)
Use a horizontal or vertical bar chart with these approximate values:
- Consumer Packaged Goods → 15–18%
- SaaS / Software → 12–22%
- B2C Brands → 10–15%
- Professional Services → 7–11%
- Manufacturing → 4–7%
- Energy / Heavy Industry → 3–5%
Quick Summary – What to Add Where
| Item | Section | Type of Visual | Priority |
| Country-wise % comparison | Key Types, Methods, and Examples | Table | High |
| Industry % comparison | Key Types, Methods, and Examples | Bar Chart | High |
| Cost Per Lead improvement curve | Best Practices and Common Mistakes | Line / Curve Chart | High |
- Goal-Based Method
It starts with determining the objective or goal that one would like to achieve (which could include leads, sales, and revenue). - Competitor or Industry Benchmark Method
You look at what similar companies spend and use that as a reference point. - Affordable Method
You decide what you can afford after covering other costs. It is not uncommon with small enterprises; however, this can hinder expansion.
Example allocation for a small online business (monthly budget of $3,000):
| Category | Percentage | Amount | Purpose |
| Paid Ads | 40% | $1,200 | Fast traffic and testing |
| Content & SEO | 25% | $750 | Long-term organic growth |
| Tools & Software | 15% | $450 | Email, analytics, design tools |
| Creative / Design | 10% | $300 | Images, videos, landing pages |
| Testing & Experiments | 10% | $300 | Trying new channels or offers |
Average Marketing Spend by Industry (% of Revenue)
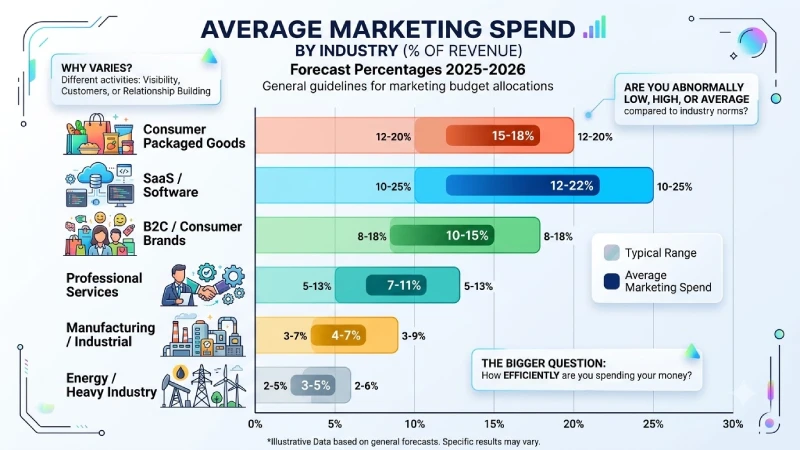
Marketing departments usually have different budget allocations depending on the kind of activities that are done in an organization. While some companies require visibility and customers, others require relationships building.
Marketing expenditure percentages relative to sales for various industries are given in the following table (forecast percentages 2025-2026):
| Industry | Average Marketing Spend (% of Revenue) | Typical Range |
| Consumer Packaged Goods | 15–18% | 12–20% |
| SaaS / Software | 12–22% | 10–25% |
| B2C / Consumer Brands | 10–15% | 8–18% |
| Professional Services | 7–11% | 5–13% |
| Manufacturing / Industrial | 4–7% | 3–9% |
| Energy / Heavy Industry | 3–5% | 2–6% |
These are general guidelines and not hard and fast rules, where a rapidly growing SaaS firm can spend on the higher side, while a steady manufacturer might spend even less and yet grow through the existing contacts.
It will give you an idea if your spending on marketing is abnormally low, high, or average compared to the industry norms. However, the bigger question that arises here is how efficiently you are spending your money.
How to Use or Apply Marketing Budget
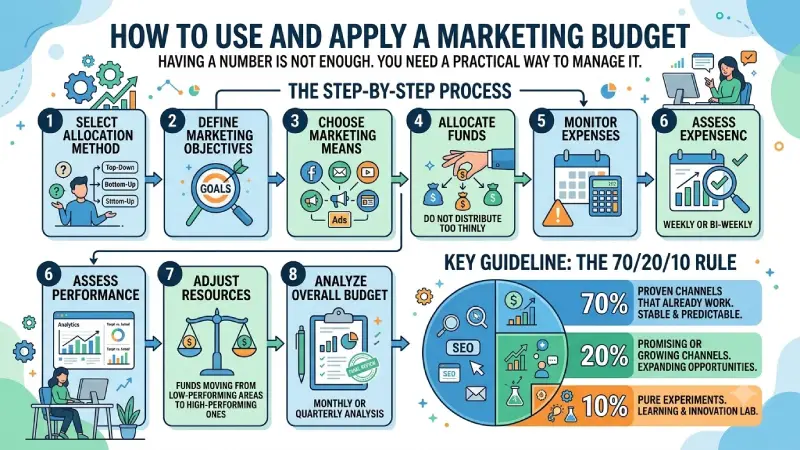
Having a number is not enough. You need a practical way to manage it.
Step-by-step process:
- Select a budget allocation method from the list above.
- Identify your major marketing objectives for the period.
- Select the best means for achieving the marketing goals.
- Allocate funds to these means (without distributing resources too thinly).
- Watch expenses on a weekly or biweekly basis.
- Assess performance against the objective.
- Allocate more resources to successful methods and fewer to less successful methods.
- The entire budget must be analyzed monthly or quarterly.
One helpful guideline that companies follow is the 70/20/10 rule:
- 70% on proven channels that already work
- 20% on promising or growing channels
- 10% on pure experiments
This keeps most of the budget productive while still allowing learning.
Best Practices and Common Mistakes
Best practices:
- Tie the budget to clear business goals
- Concentrate on a few channels that you can effectively controlTrack both cost and results (not just spend)
- Keep some flexibility so you can shift money when something works
- Review performance regularly
- Include all costs (tools, freelancers, ads, content, etc.)
- Protect some budget for testing new ideas
Cost Per Lead Improvement After Better Budget Allocation
| Month |
Cost Per Lead |
| Month 1 | $52 |
| Month 2 | $47 |
| Month 3 | $39 |
| Month 4 | $31 |
| Month 5 | $26 |
| Month 6 | $22 |
What Better Budget Management Can Look Like Over Time
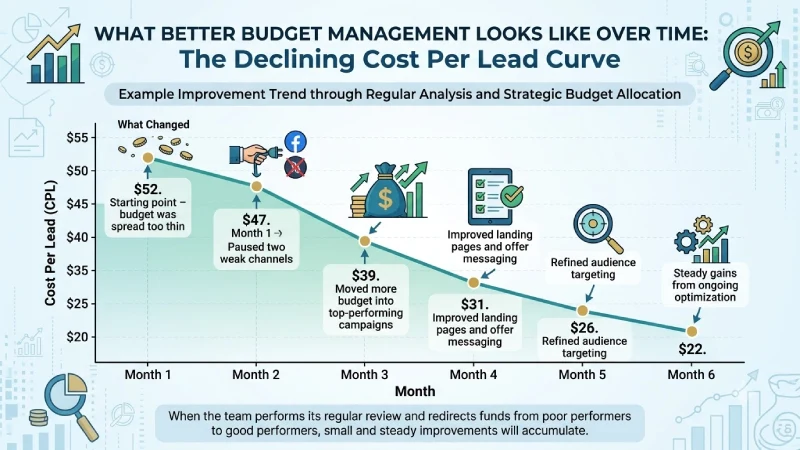
As a company begins to manage its marketing budget rather than just setting it and ignoring it, performance generally improves slowly.
The following example demonstrates the decreasing Cost Per Lead over a period of six months through the regular analysis of the marketing budget and allocating it to more efficient channels..
Example Improvement Trend
| Month | Cost Per Lead | What Changed |
| Month 1 | $52 | Starting point – budget was spread too thin |
| Month 2 | $47 | Paused two weak channels |
| Month 3 | $39 | Moved more budget into top-performing campaigns |
| Month 4 | $31 | Improved landing pages and offer messaging |
| Month 5 | $26 | Refined audience targeting |
| Month 6 | $22 | Steady gains from ongoing optimization |
It is very much possible when the team performs its regular review and redirects funds from poor performers to good performers. There won’t be any sudden jump. Small and steady improvements will accumulate.
A simple line chart showing Cost Per Lead steadily declining over six months makes the benefit of active budget management easy to see.
Common mistakes:
- Setting a budget with no clear goals
- Spreading money across too many channels
- Continuing to fund channels that are not performing
- Ignoring the full cost of marketing (only counting ad spend)
- Cutting the budget the moment results slow down
- Copying a competitor’s spend level without understanding their situation
- Never reviewing or adjusting the allocation
One of the most expensive mistakes is treating the marketing budget as fixed for the whole year. Markets change. What worked six months ago may not work as well today. The best operators review and adjust regularly.
Where to add a line or curve chart (optional):
In the Best Practices section, you can add a simple line chart showing an example of marketing ROI or cost-per-lead improving over several months after better budget allocation. This makes the benefit of active management more visual.
Frequently Asked Questions
How much should a small business budget for marketing expenses?
Generally around 7-15% depending on its objectives and the industry it operates in.
Does marketing budget need to scale proportionally with revenue?
No. The older the business is and the more brand recognition and referrals it has gained, the less will be the percentage of marketing budget.
What should be the return on investment?
It really depends on your margins and type of business. However, the common goal is for one dollar invested in marketing to yield three to five dollars in revenue or more.
How often should I review my marketing budget?
Monthly review is good, quarterly in-depth analysis – even better.
Paid traffic vs. content marketing, which one is preferable to put more effort into?
It all depends on how fast you want to see the result. Paid traffic is quicker compared to SEO, but both need efforts from your side..
Conclusion
Marketing budgets are not just constraints on spending; they are decision-making aids. There is no optimal amount because it varies by circumstance, but the process of managing and allocating the budget generally carries more importance than the absolute sum.
Allocate a realistically sized budget, concentrate on a select number of channels, be honest about the results, and continue adjusting the strategy accordingly. Organizations that use their marketing budget as a management system will see more return from each expenditure.
Be reasonably close with your allocation, but then concentrate on how you spend the budget. This strategy still tends to beat many budgeting models.