


Marketing departments often measure dozens of metrics. Very few understand which ones matter.
Marketing metrics are nothing but the metrics that tell you whether your marketing is working. The right choice will help make decision-making simpler. However, the wrong choice will only get you confused and lost in a sea of numbers.
The following article will assist in gaining insight into the definition of marketing metrics, its significance, types, its application in the business world, and the dangers to be avoided.
Marketing Metrics: Meaning and Key Concepts
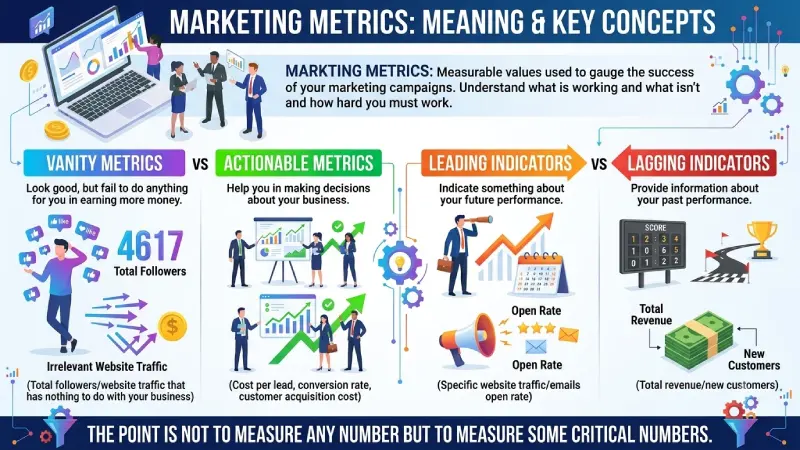
Marketing metrics are the measurable values used to gauge the success of your marketing campaigns. They can assist you to understand what is working and what isn’t and how hard you must work at it.
Key concepts:
- Vanity Metrics: These metrics are the ones that look good, but fail to do anything for you, when it comes to helping you earn more money (total followers/website traffic that has nothing to do with your business).
- Actionable Metrics: These metrics will help you in making decisions about your business (cost per lead, conversion rate, customer acquisition cost).
- Leading Indicators: These metrics indicate something about your future performance (specific website traffic/emails open rate).
- Lagging Indicators: These metrics provide information about your past performance (total revenue/new customers).
The point is not to measure any number but to measure some critical numbers.
Why Marketing Metrics Matters
The lack of metrics turns marketing into guessing. You spend money and produce content, but you will never be able to determine if it works in favor of your company.
The right metrics can help you:
- Understand what channels and campaigns work for you
- Not waste money on useless but busy stuff
- Better understand how to manage your budget and focus
- Convince others in your company that your marketing adds value
- Grow rather than repeat the same mistakes
The year 2026 will be characterized by advertisers having to pay more money and competing in tougher conditions. In such circumstances, it is even more crucial to know what to measure. The reason is that when a company understands how much it takes to get the client and how valuable he or she is, it makes better decisions.
Key Types, Methods, and Examples
Marketing metrics can be grouped into a few practical categories.
| Category | Key Metrics | What It Tells You | Healthy Benchmark Examples (2026) |
| Acquisition | CAC, Cost Per Lead, Traffic by source | How efficiently you get new people | CAC varies widely by industry |
| Conversion | Conversion Rate, Trial-to-Paid, Lead-to-Customer | How well you turn interest into action | Website CVR often 2–4% |
| Revenue & Efficiency | ROAS, MER, Revenue per visitor | How much money marketing brings back | ROAS 3:1 to 5:1 common targets |
| Customer Value | LTV, LTV:CAC ratio, Repeat purchase rate | How valuable customers are over time | LTV:CAC of 3:1 or higher is solid |
| Retention & Engagement | Churn rate, Retention rate, Email engagement | How well you keep customers | Depends heavily on business model |
Key indicators for most firms:
- Customer acquisition cost (CAC): total cost of marketing and sales divided by number of customers acquired.
- Customer lifetime value (LTV): money (profits/earnings) made from customer during the period of business dealings with him/her.
- LTV:CAC Ratio: One of the most obvious indicators of successful marketing model. Companies try to have 3:1 ratio.
- Conversions: Conversion rate is the percent of clients doing what you want from them to do.
- Return on Advertising Spend (ROAS) / Marketing Efficiency Ratio (MER): Revenue / Marketing Costs.
- Retention/Churn: What percent of clients stays or leaves.
Simple example for a small online business:
| Metric | Current Number | Target | Notes |
| Website Conversion Rate | 2.1% | 3.0% | Needs improvement |
| Cost Per Lead | $38 | Under $25 | Currently too high |
| CAC | $145 | Under $110 | Main focus area |
| LTV | $420 | Maintain or grow | Healthy |
| LTV:CAC Ratio | 2.9 : 1 | 3.5 : 1 or higher | Close but can improve |
Average LTV:CAC Ratio by Business Type (Typical Ranges in 2026)
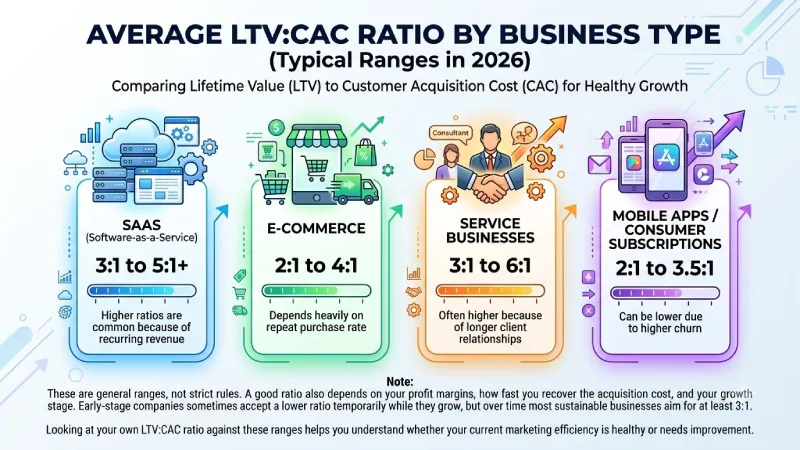
Different types of businesses usually operate with different healthy ranges for Customer Acquisition Cost and Lifetime Value. The chart below shows common average LTV:CAC ratios across four broad business models.
| Business Type | Typical LTV:CAC Range | What It Usually Means |
| SaaS | 3:1 to 5:1+ | Higher ratios are common because of recurring revenue |
| E-commerce | 2:1 to 4:1 | Depends heavily on repeat purchase rate |
| Service Businesses | 3:1 to 6:1 | Often higher because of longer client relationships |
| Mobile Apps / Consumer Subscriptions | 2:1 to 3.5:1 | Can be lower due to higher churn |
Note: This is not a hard and fast rule but rather some suggestions for you to consider. Your ratio would also be contingent upon your profit margin, how quickly you will recover the money that you spent on the investment, and at what stage you are in the growth cycle.
Looking at your own LTV:CAC ratio against these ranges helps you understand whether your current marketing efficiency is healthy or needs improvement..
How to Use or Apply Marketing Metrics
Tracking numbers is useless if you don’t use them to make decisions.
How to use marketing metrics in practice:
- Select somehow 5-8 metrics related to your goals as a business.
- The metrics must be quantifiable (measurement is very important).
- Define easy targets for each metric.
- Have the data analyzed on a weekly/ bi-weekly basis.
- Every time you do the above process, one question will definitely keep coming to your mind:
“What should we be doing more/less/differently?”
- Modify the process step by step to understand the impact of your decision.
- Highlight the most important measures for all marketers/salespeople.
A simple monthly habit that works well:
At the end of each month, look at your top 5 metrics and write three short notes:
- What improved
- What got worse
- What we will change next month
Best Practices and Common Mistakes
Best practices:
- Track fewer metrics, but make sure they matter
- Always connect metrics back to revenue or profit
- • Examine trends through time and not focus on just one number.
- • Bring together qualitative and quantitative information.Review metrics regularly and act on them
- Make sure tracking is accurate before making big decisions
- Focus on the metrics that influence customer acquisition and retention
What Improvement Can Look Like Over Time
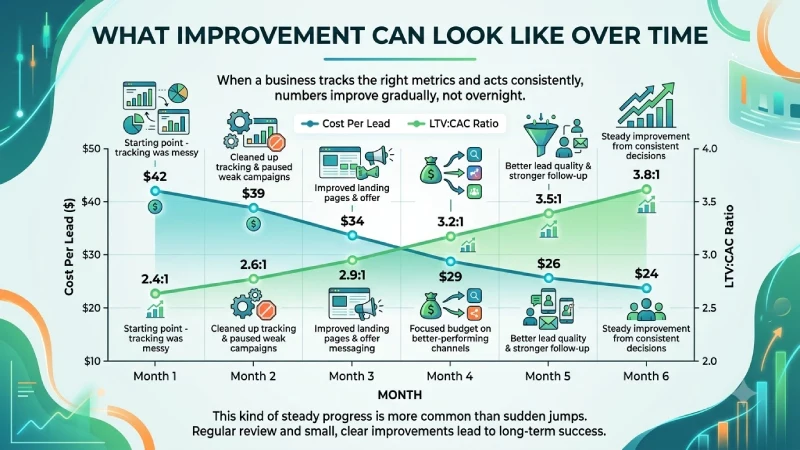
When a business starts tracking the right metrics and acts on them consistently, the numbers usually do not jump overnight. Improvement tends to happen gradually.
The chart below shows a realistic example of how Cost Per Lead and LTV:CAC ratio can improve over six months after a team begins focusing on the metrics that actually matter.
Example Trend (Illustrative)
| Month | Cost Per Lead | LTV:CAC Ratio | What Was Happening |
| Month 1 | $42 | 2.4 : 1 | Starting point – tracking was messy |
| Month 2 | $39 | 2.6 : 1 | Cleaned up tracking and paused weak campaigns |
| Month 3 | $34 | 2.9 : 1 | Improved landing pages and offer messaging |
| Month 4 | $29 | 3.2 : 1 | Focused budget on better-performing channels |
| Month 5 | $26 | 3.5 : 1 | Better lead quality and stronger follow-up |
| Month 6 | $24 | 3.8 : 1 | Steady improvement from consistent decisions |
This gradual improvement occurs more often than large leaps. The most important factor here is not perfection from the very start but rather consistent evaluation and gradual progress every month.
It becomes easier to make people believe in your progress by simply presenting a line chart where you can see Cost Per Lead decreasing and LTV/CAC increasing within six months.
Common mistakes are:
- Too many vanity metrics
- Focusing only on short-term performance and forgetting long-term value (LTV)
- Not knowing the actual cost of acquiring a client
- Becoming happy with increased traffic but declining conversion/profitability
- Swinging your strategy every week due to data from one week
- Not considering the quality of leads or customers
- Forgetting to revise the metrics in case of changes on the website or campaign
The other huge challenge is when companies believe they’re succeeding as traffic or social followers are increasing but the price to acquire a paying customer continues to go up without profits changing.
Frequently Asked Questions
Which are the main marketing metrics?
For most businesses: CAC, LTV, LTV to CAC ratio, conversion rate, and overall return on marketing spend.
Which is a good LTV to CAC ratio?
Most profitable companies strive for 3:1 or even more. It all depends on your industry and your margins.
How often should I look at marketing metrics?
Check the main metrics on a weekly basis. Review your performance in depth once a month.
Should I measure the same metrics forever?
No. With the change of your company’s dynamics and goals, there may be other metrics that matter more.
What is the difference between ROAS and ROI?
The main difference is that ROAS usually takes into account only revenues gained from ad budget. The ROI takes into account profit after all expenses are deducted.
Conclusion
Marketing metrics are nothing more than helpful information that allows you to make better decisions. When you track hundreds of numbers, you get noise. When you track a few important numbers, you create clarity.
Look for the metrics that measure the efficiency of your customer acquisition and their lifetime value. Monitor them constantly, take action according to your findings, and improve yourself all the time.
The companies that continue growing are normally the companies that understand their true numbers and apply them to decision making instead of waiting for miracles or vanity metrics.